Can demographic data be borrowed across species? Probably not for plants
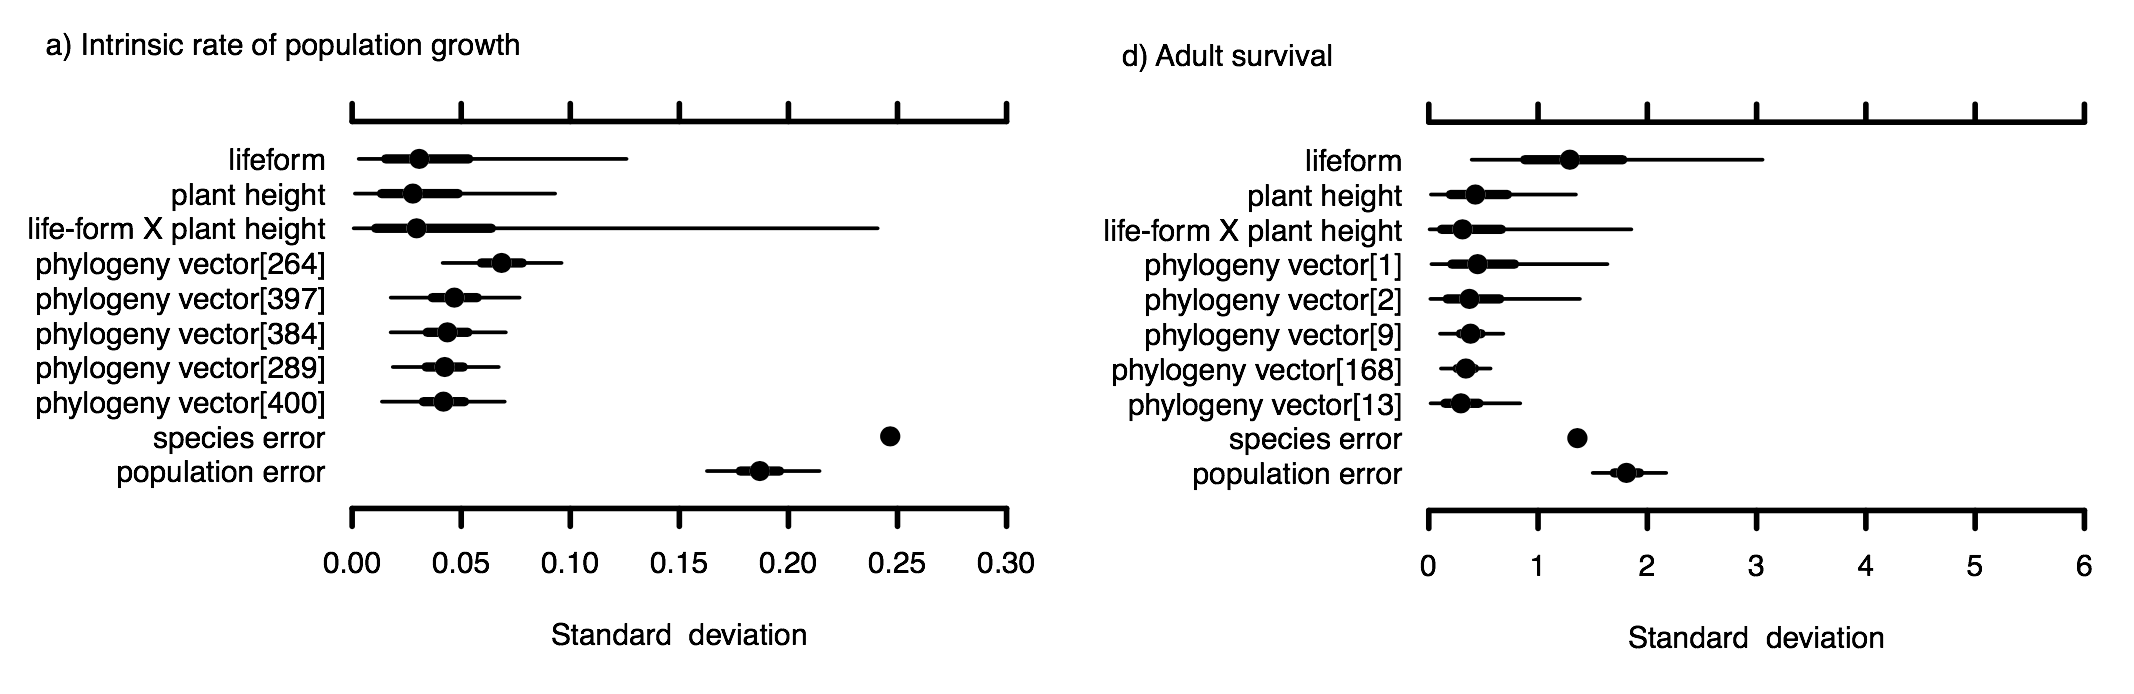
by Rob Salguero-Gomez on Aug 27, 2018A common challenge in conserving endangered species is not knowing enough about the species itself. Information about the basic biology of the threatened species is critical for helping to determine how well the species is doing and exploring possible strategies for recovery. In particular, information on survival and fecundity rates at different life stages can be used to identify which stages may need the most protection. Demographic rates can also be used to project what the population will look like in the future and under different possible recovery strategies. Unfortunately, data on survival and fecundity rates are rarely available, especially for endangered species, because they are gathered through detailed population monitoring over several years or more. In absence of these data, managers and scientists often suggest “borrowing” data from similar species to fill those data gaps. For this to work, however, the species that are considered similar would need to have demographic rates that are nearly the same or follow similar patterns. In our recently published study, we tested this assumption. We asked whether plant species that are similar (closely related and/or have similar biological traits) would have similar demographic rates. We used matrix population models from the COMPADRE Plant Matrix Database to estimate three types of demographic rates: intrinsic population growth, stage-specific survival, and fecundity rates, for populations from 425 plant species. We constructed a hierarchical Bayesian model to predict these demographic rates based on maximum plant height and as many life history traits as we were able to find (which was unfortunately not very many for plants!). We also estimated the strength of the phylogenetic signal in these rates, which would tell us the extent to which closely related species would have similar demographic rates. By modelling the different populations for the same species hierarchically, we were also able to look at how demographic rates varied within a species compared to among different species. This provides insight into whether it would be more appropriate to borrow data from a different population of the same species compared to borrowing data from a similar species. We found that demographic rates were not well-predicted based on phylogenetic relatedness and traits. Phylogenetic signal was weak for population growth and survival rates, but was relatively strong for fecundity rates (Pagel’s lambda = 0.71, 95% CI = 0.43, 0.85). Demographic rates also varied greatly among populations of the same species. For intrinsic population growth, the largest sources of variation in our model were the unexplained variation among species (after accounting for traits and phylogeny), and unexplained variation among populations of the same species (compare “species error” and “population error” in Fig. a; taken from Fig. 2 in the paper). This indicates the traits we included in the model were not good predictors of population growth, and adding other species-level traits may improve the predictions for this demographic rate. However, intrinsic growth rates also varied a lot among populations of the same species. For the other demographic rates we tested, the unexplained variation among populations was actually higher than that among species (e.g., for adult survival shown in Fig. d). This means that differences in survival and fecundity rates among populations of the same species was as great or greater than the differences among different species. This finding suggests that these vital rates are highly dependent on population-level factors such as the specific environmental conditions for the given location and year.
 Our results suggest that borrowing data from similar species, or even a different population of the same species, may not be useful in a conservation context. This is so because the demographic rates for a closely related or similar species could actually be very different from that of the focal species, and using those rates could lead to very different conclusions about how a population is doing. These findings are consistent with previous studies that have asked similar questions, yet the idea of borrowing data continues to crop up because the lack of data is so pervasive. Demographic monitoring can be costly and time consuming, and therefore it is rarely done (or done well), especially for threatened species. We hope our study can help to promote more direct species monitoring to help inform species conservation and management.
Judy Che-Castaldo
Research Scientist at Lincoln Park Zoo - Chicago, USA
Core committee member of COMPADRE & COMADRE
Citation
Che-Castaldo, J.P., C.C. Che-Castaldo, M.C. Neel. 2018. Predictability of demographic rates based on phylogeny and biological similarity. Conservation Biology. https://www.onlinelibrary.wiley.com/doi/pdf/10.1111/cobi.13135
Our results suggest that borrowing data from similar species, or even a different population of the same species, may not be useful in a conservation context. This is so because the demographic rates for a closely related or similar species could actually be very different from that of the focal species, and using those rates could lead to very different conclusions about how a population is doing. These findings are consistent with previous studies that have asked similar questions, yet the idea of borrowing data continues to crop up because the lack of data is so pervasive. Demographic monitoring can be costly and time consuming, and therefore it is rarely done (or done well), especially for threatened species. We hope our study can help to promote more direct species monitoring to help inform species conservation and management.
Judy Che-Castaldo
Research Scientist at Lincoln Park Zoo - Chicago, USA
Core committee member of COMPADRE & COMADRE
Citation
Che-Castaldo, J.P., C.C. Che-Castaldo, M.C. Neel. 2018. Predictability of demographic rates based on phylogeny and biological similarity. Conservation Biology. https://www.onlinelibrary.wiley.com/doi/pdf/10.1111/cobi.13135
Social Media