Illuminating the world’s demographic dark corners
by Rob Salguero-Gomez on Apr 28, 2017
Perhaps by pure coincidence, I was the first user to have downloaded COMPADRE when it first went live, back in 2014. At that time, Rob Salguero-Gómez and I were at the same airBnB, and ready to attend the EvoDemoS meeting at Stanford. At that time and place, we were less than 60 km from the nearest matrix population model in the database (
Calochortus tiburonensis; (Fiedler 1987)). My Ph.D. fieldwork brought me considerably closer, and not just because I worked with historic matrix population models collected near the field station. Instead, yellow-bellied marmots (
Marmota flaviventris (Ozgul et al. 2009, 2010)) scratched and gnawed under my cabin’s floorboards every day. In short, my thinking about demography has been shaped not only by very well-studied places, but also in them.
It will come as no surprise to most readers of this blog that certain regions of the world and branches of the tree of life are more strongly represented than in biological databases, whereas other parts and taxa are almost entirely unsampled. COMPADRE and COMADRE are no exception (Salguero-Gómez et al. 2015, 2016). Indeed, we lose a lot of information by only considering the current state of our field’s geographic bias. We stand to learn much more if we could see its trajectory. By analogy, the power of matrix models stems from connecting static snapshots of a population’s state to reveal the motion of life histories and population dynamics as they unfold in time. We can use an analogous approach to animate our progress towards illuminating the dark corners of demography. I was curious what these patterns would show, so I did just that using the >50 years of georeferenced matrix population models contained in the latest releases of COMPADRE and COMADRE.
We most commonly think about spatial biases as hotspots of research activity, but what happens when we flip that question around and ask where the least studied places are? To do this, I wrote an
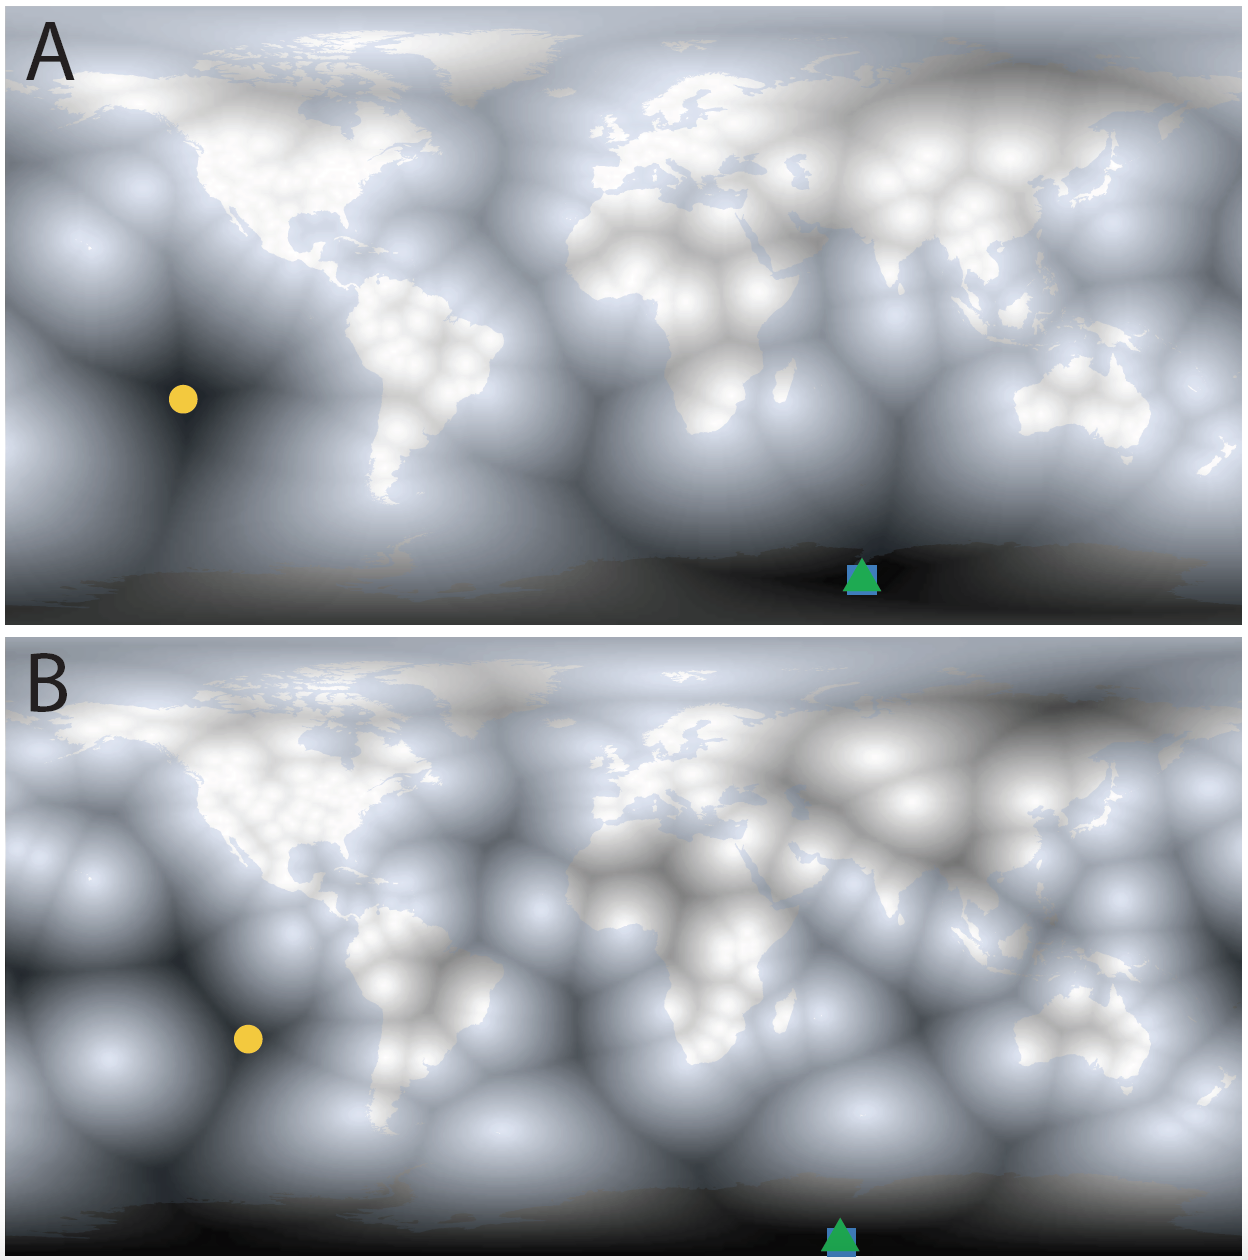
R script that divides the Earth’s surface into pixels and measures the distance from each pixel to the nearest matrix population model* (Fig. 1)—the brightest pixels show populations where a matrix model has been constructed. Using this approach, it is rather easy to find the place that is the most isolated from the illumination of demography.

Fig. 1. The current darkest corners of demography for (A) plant matrix population models in the COMPADRE Plant Matrix Database and (B) animal matrix population models in the COMADRE Animal Matrix Database. The most isolated points from all matrix population models are shown as colored dots (blue square: of the whole Earth, green triangle: of land masses, yellow circle: of land masses excluding the largely uninhabitable Antarctica).
In the most recent versions of the sister datasets, Henderson Island and Rapa Nui (Easter Island) are the most isolated lands from a matrix model for plants and animals, respectively**. To me, two other patterns are apparent when the data are presented this way. First, plant demographers (Fig. 1A) have better sampled the tropics than have animal demographers. Part of this may stem from the fact that many animals are almost certainly harder to mark and recapture in a dense tropical forest whereas plants are more easily re-found. The second pattern that strikes me is that animal demographers have sampled oceanic islands much more thoroughly than plant demographers. Again, this may be related to the higher mobility of animals and the desirability of a closed population (e.g., sheep wrangling on St. Kilda
vs. anywhere on the mainland). However, it may also be related to the fact that many pelagic animals use remote islands as breeding locations (e.g., the Laysan albatross). Most animal matrix models are age structured (Salguero-Gomez et al. 2016), so marking animals at birth is made considerably easier if they all gather in one place to raise young. You may have other candidate explanations for these differing spatial biases, and I’d certainly be keen to hear them.
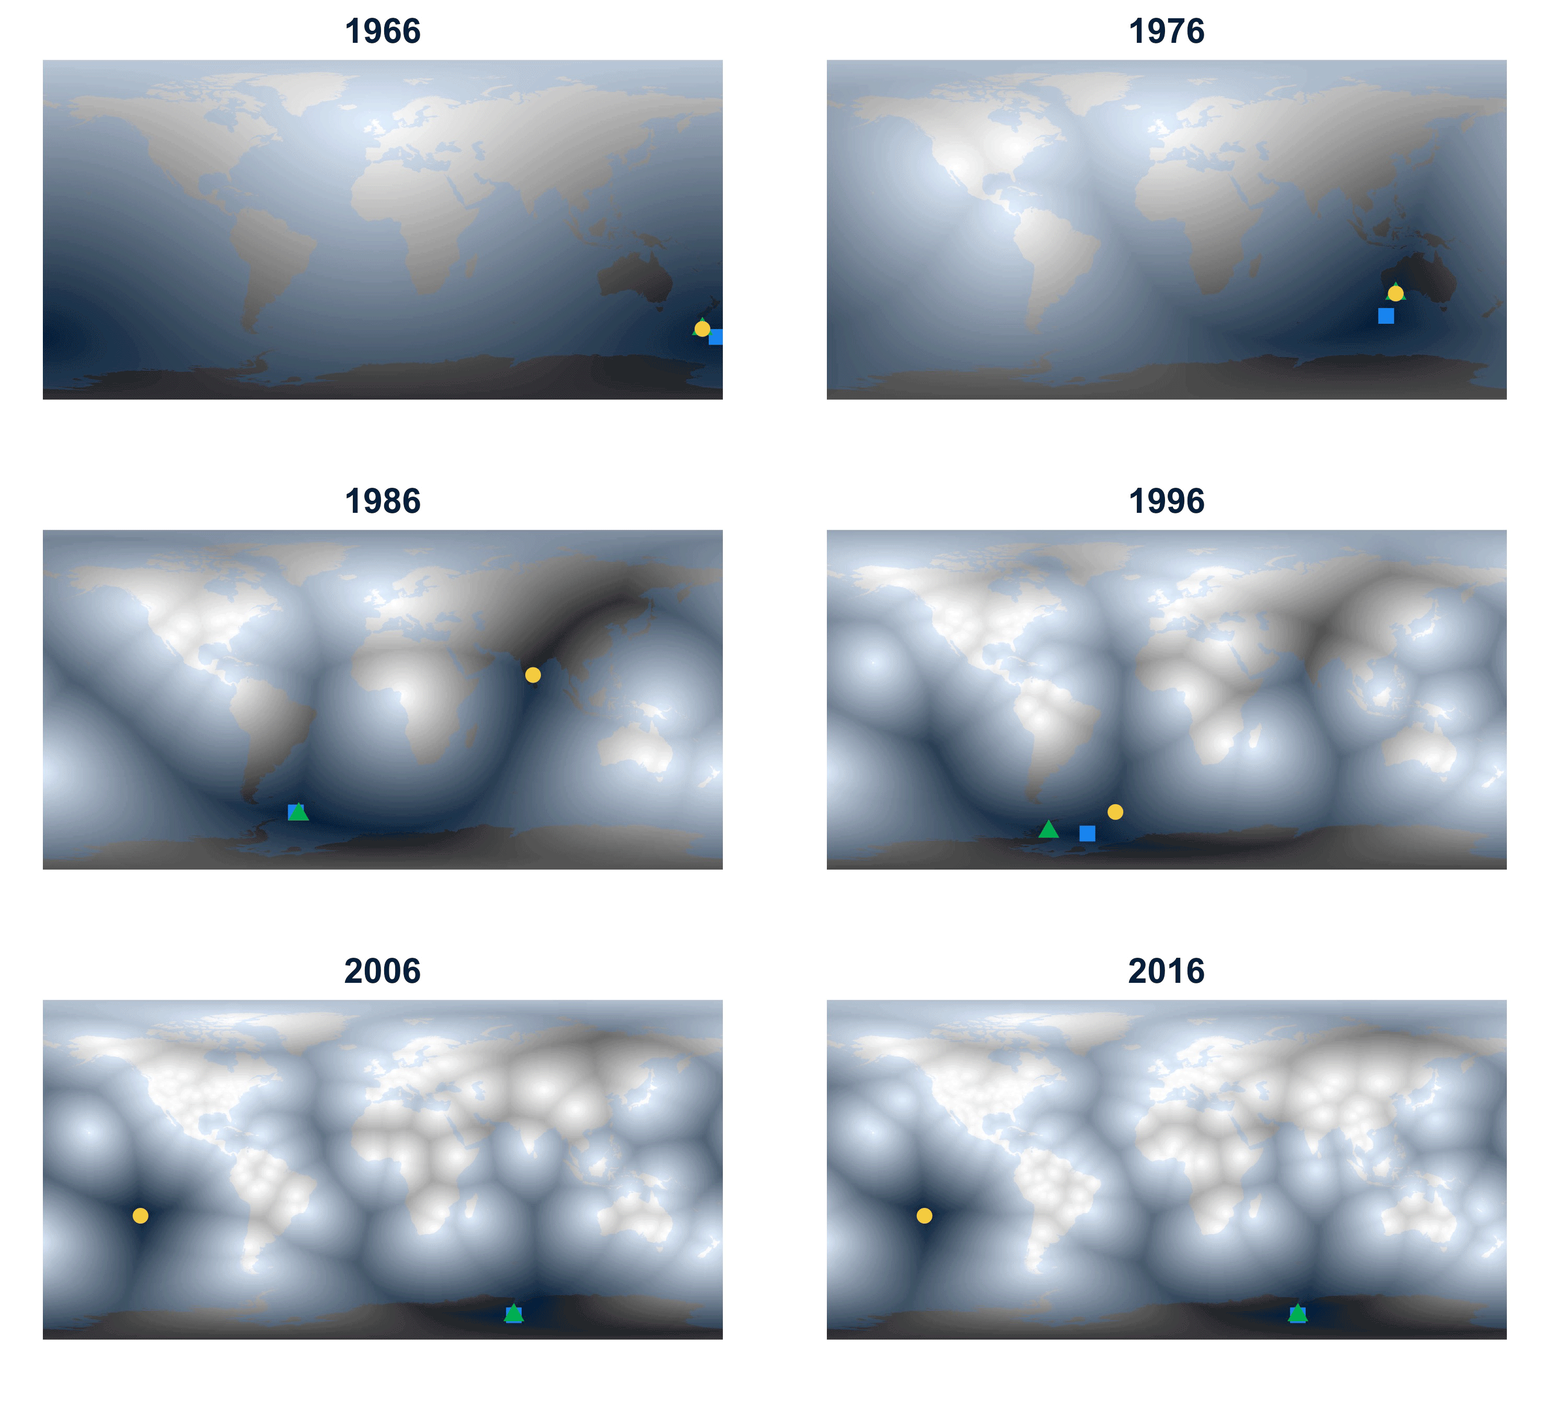
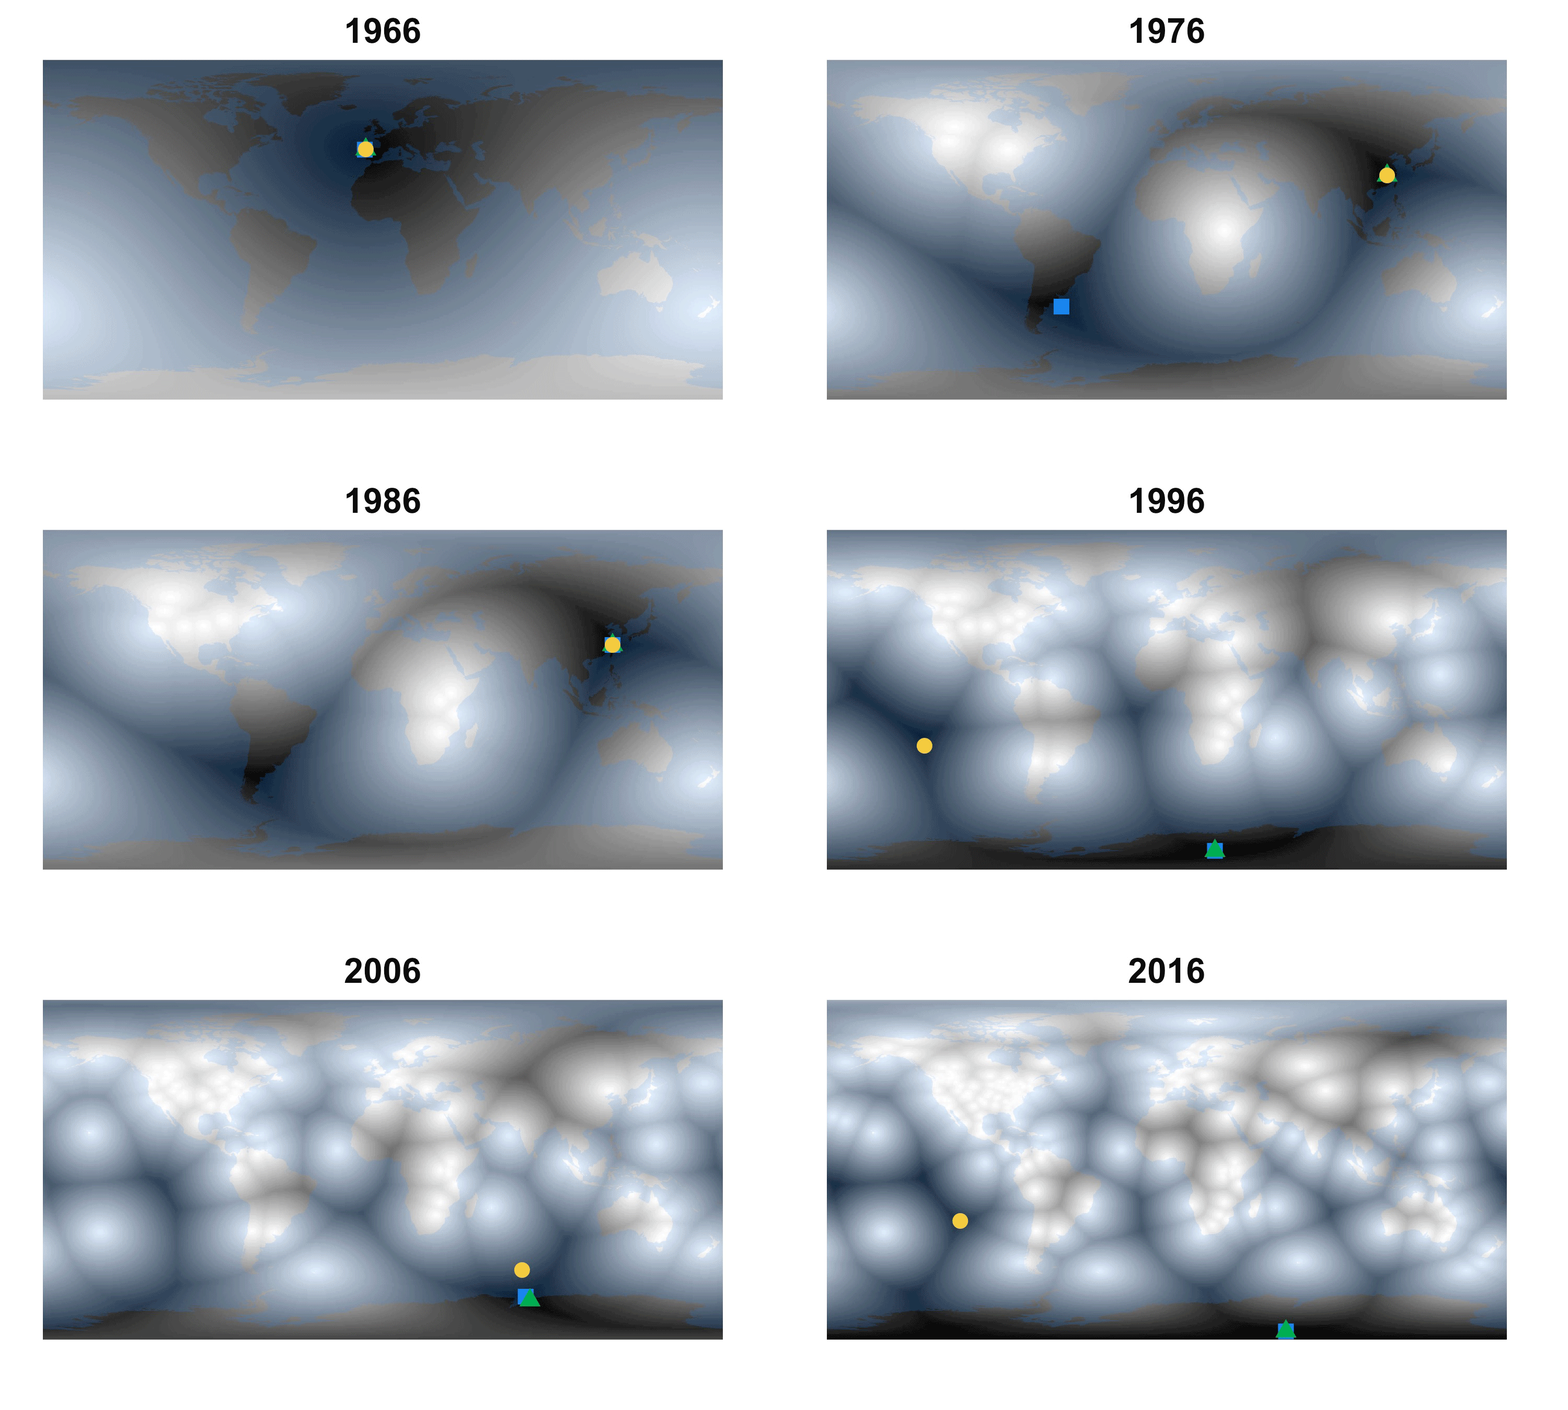
By animating these maps over time, we gain a much deeper understanding of how demographers have been illuminating demographic dark corners, and we can see how bringing demographic models to new areas changes the arrangement of the darkest corners (Fig. 2).


Fig. 2. How the demographic darkest corner has moved since the advent of matrix population models (1965-2016). Plant matrix models from COMPADRE (above) and animal matrix models from COMADRE (below) are shown separately with symbols as in Fig. 1. The color gradient rescales each year to better highlight the least known areas.
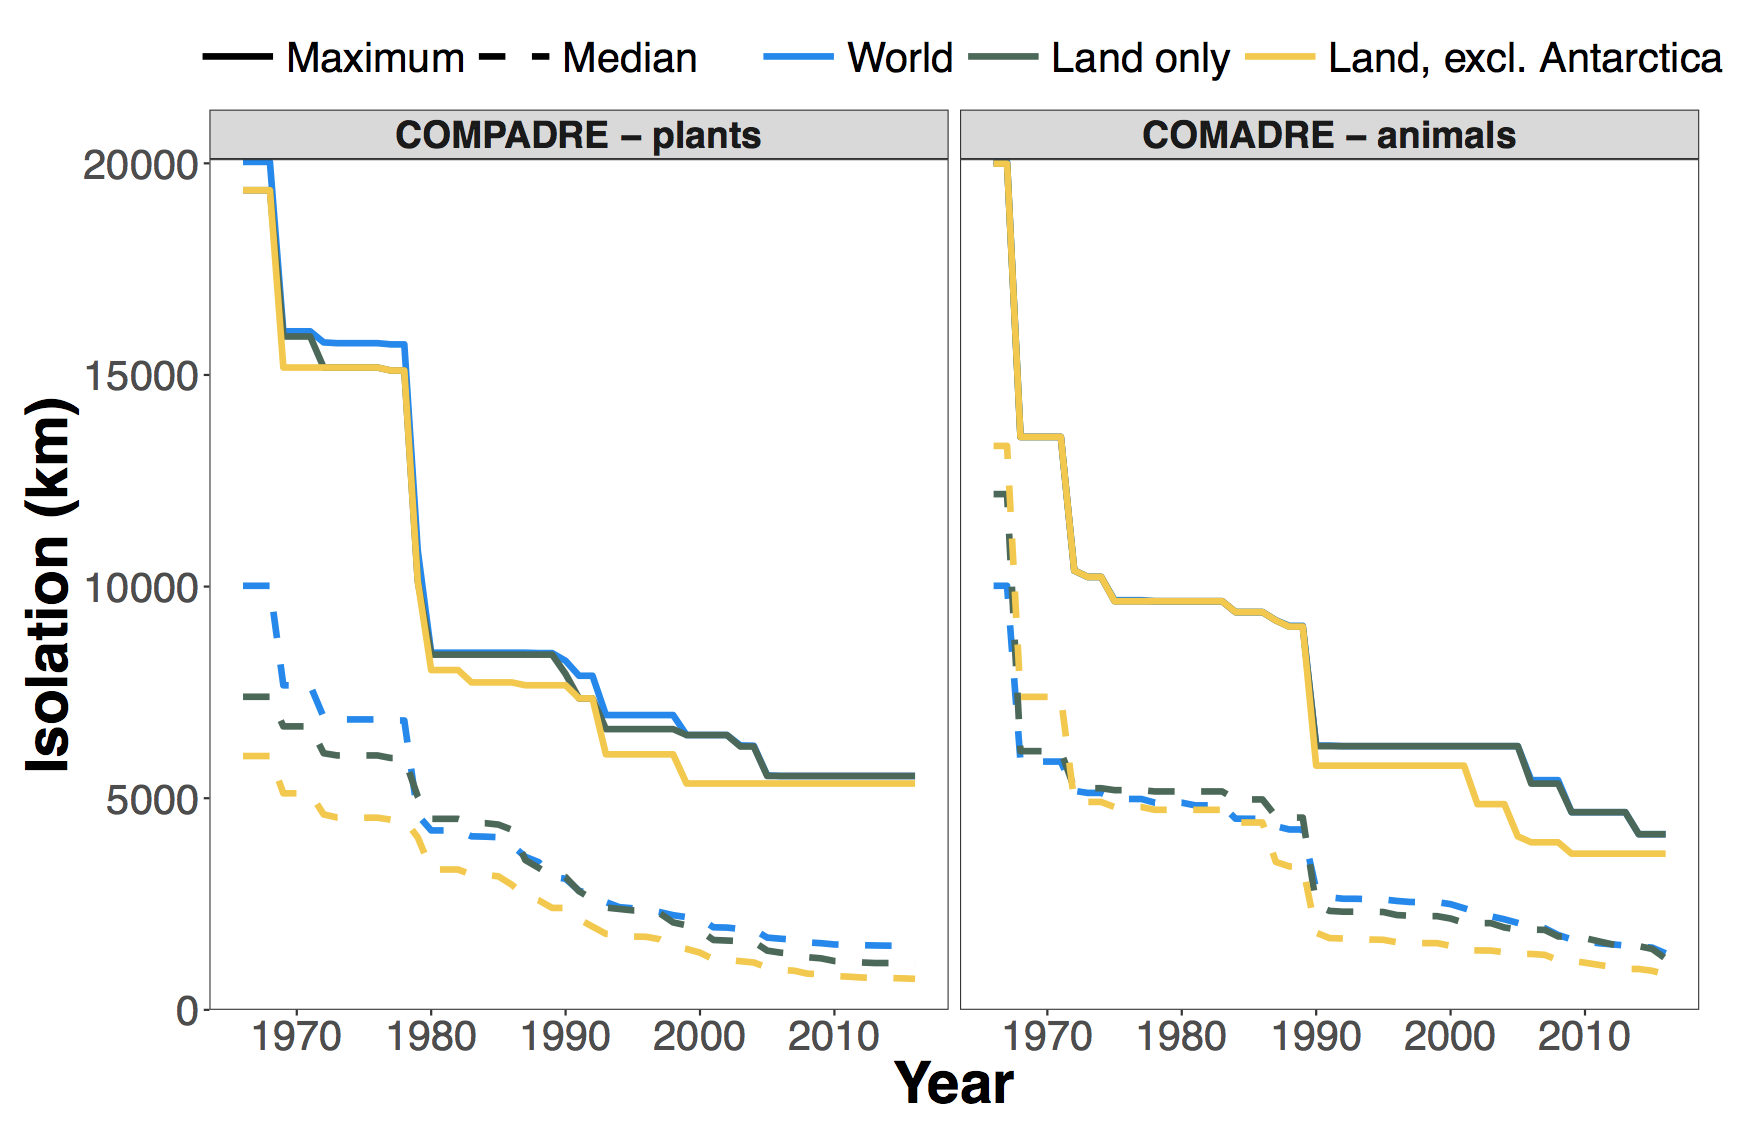
Finally, we can condense this information into a plot of how the distance to the most isolated place has decreased over time as more demographic studies have been conducted (Fig. 3).

Fig. 3. Decline in the maximum (solid line) and median (dashed line) distances away from a matrix population model for COMPADRE (left) and COMADRE (right) over time. Colours show different subsets where blue is any point on land or water, green is restricted to points on land, and yellow is restricted to points on land excluding Antarctica. Note that the maximum possible isolation distance on Earth is approximately 20,038 km.
Even though the current version of COMPADRE has more than twice the number of unique population locations than does COMADRE, the demographic dark places for plants have remained darker for plants than for animals since the late 1980s. Moreover, Henderson Island has remained the most isolated point from plant demography for almost 20 years! The picture is a bit more optimistic if we look at the median distance from a matrix model. In just over 50 years, we have sampled such that half of the world is <1500 km from a plant matrix model and is <1300 km from an animal matrix model.
It is worth asking what, if anything, we are missing with these geographic biases. For plants, we are certainly under-sampling some disturbance regimes and life histories that tend to be more common on small remote islands. For example, <<1% of taxa in COMPADRE are modelled as truly dioecious (i.e., separate sexes) compared to ca. 5% of plant species that have this sexual system (Renner 2014). Improved sampling of oceanic islands—several of which have elevated frequencies of dioecious species (Sakai and Weller 1999)—could simultaneously reduce both the geographic and life history biases in the database. For animals, sampling is sparsest in some of the most species rich ecosystems on the plant like the Amazon, the Congo, and tropical southeast Asia. It is hard to imagine how better sampling in these areas could fail to reveal unique and surprising insights.
As I now write this from my postdoc position in Zurich, I’m again finding myself in a demographic bright spot. The nearest matrix population model is an hour away by train (white stork,
Ciconia ciconia; (Schaub et al. 2004)). Rapa Nui, on the other hand would be 34 hours by plane***, and Henderson Island is all but impossible to reach without a private yacht. Still, we can and should work to target more accessible places that are nonetheless demographic dark spots. Moreover, we can bolster the utility of these databases by targeting clades and life history strategies that are underrepresented, but that will have to remain the subject for a future post.
Will Petry
Postdoctoral researcher at ETH Zurich
*This is a raster-based approximation of Voronoi polygons. It’s slow and clunky, but it has the advantage of accounting for the Earth’s ellipsoid shape. I used the WGS84 ellipsoid and cells that are 1/12° (+/-9.25 km) on each side.
**And here I reveal my own terrestrial bias.
***Assuming no connections go awry.
Literature cited
Fiedler, P. L. 1987. Life history and population dynamics of rare and common mariposa lilies (
Calochortus Pursh: Liliaceae). Journal of Ecology 75:977–995.
Ozgul, A., D. Z. Childs, M. K. Oli, K. B. Armitage, D. T. Blumstein, L. E. Olson, S. Tuljapurkar, and T. Coulson. 2010. Coupled dynamics of body mass and population growth in response to environmental change. Nature 466:482–485.
Ozgul, A., M. K. Oli, K. B. Armitage, D. T. Blumstein, and D. H. Van Vuren. 2009. Influence of local demography on asymptotic and transient dynamics of a yellow‐bellied marmot metapopulation. The American Naturalist 173:517–530.
Renner, S. S. 2014. The relative and absolute frequencies of angiosperm sexual systems: Dioecy, monoecy, gynodioecy, and an updated online database. American Journal of Botany.
Sakai, A. K., and S. G. Weller. 1999. Gender and sexual dimorphism in flowering plants: A review of terminology, biogeographic patterns, ecological correlates, and phylogenetic approaches. Pages 1–31
in M. A. Geber, T. E. Dawson, and L. F. Delph, editors. Gender and sexual dimorphism in flowering plants. Springer Berlin Heidelberg.
Salguero-Gómez, R., O. R. Jones, C. R. Archer, C. Bein, H. de Buhr, C. Farack, F. Gottschalk, A. Hartmann, A. Henning, G. Hoppe, G. Römer, T. Ruoff, V. Sommer, J. Wille, J. Voigt, S. Zeh, D. Vieregg, Y. M. Buckley, J. Che-Castaldo, D. Hodgson, A. Scheuerlein, H. Caswell, and J. W. Vaupel. 2016. COMADRE: a global data base of animal demography. Journal of Animal Ecology 85:371–384.
Salguero-Gómez, R., O. R. Jones, C. R. Archer, Y. M. Buckley, J. Che-Castaldo, H. Caswell, D. Hodgson, A. Scheuerlein, D. A. Conde, E. Brinks, H. de Buhr, C. Farack, F. Gottschalk, A. Hartmann, A. Henning, G. Hoppe, G. Römer, J. Runge, T. Ruoff, J. Wille, S. Zeh, R. Davison, D. Vieregg, A. Baudisch, R. Altwegg, F. Colchero, M. Dong, H. de Kroon, J.-D. Lebreton, C. J. E. Metcalf, M. M. Neel, I. M. Parker, T. Takada, T. Valverde, L. A. Vélez-Espino, G. M. Wardle, M. Franco, and J. W. Vaupel. 2015. The COMPADRE plant matrix database: An open online repository for plant demography. Journal of Ecology 103:202–218.
Schaub, M., R. Pradel, and J.-D. Lebreton. 2004. Is the reintroduced white stork (
Ciconia ciconia) population in Switzerland self-sustainable? Biological Conservation 119:105–114.


